Weekly Summary:
This week, we practiced making velocity-time graphs from other representations of motion (position-time graphs, motion maps, written descriptions). We also used Logger Pro and motion sensors to check if our predictions were correct. The key points mentioned were:
This week, we practiced making velocity-time graphs from other representations of motion (position-time graphs, motion maps, written descriptions). We also used Logger Pro and motion sensors to check if our predictions were correct. The key points mentioned were:
- Looking at the slope of a x-t graph to determine the velocity
- Sketching what the given velocity would look like on a v-t graph
- Movement away from the reference position (or motion sensor) means the object is moving in the positive direction
- Movement toward the reference position (or motion sensor) means the object is moving in the negative direction
Quiz Directions:
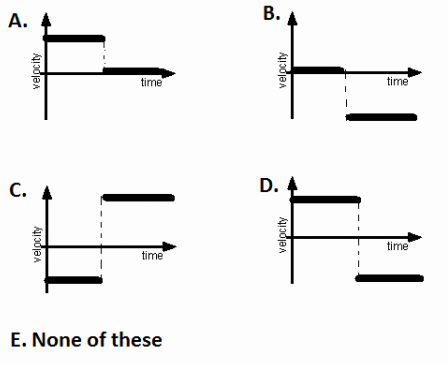
The following velocity-time graphs were obtained using the carts on the tracks and LoggerPro. Match the correct v-t graph shown below to the correct description. Each choice will be used only once.
The following velocity-time graphs were obtained using the carts on the tracks and LoggerPro. Match the correct v-t graph shown below to the correct description. Each choice will be used only once.