Weekly Summary:
This week, we practiced interpretting motion maps. We were asked to crate a data table, position vs. time graph, and written description that described the motion represented in different motion maps. The key points mentioned and discussed were:
This week, we practiced interpretting motion maps. We were asked to crate a data table, position vs. time graph, and written description that described the motion represented in different motion maps. The key points mentioned and discussed were:
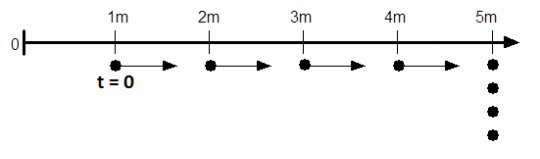
- Looking at the t=0 dot to describe the starting position of the motion map
- Looking at how the t=0 dot gives us the vertical (y) intercept of the position vs. time graph
- Understanding that the arrows on a motion map tell us about the object's velocity
- Understanding that longer arrows and further spaced dots indicate that an object is moving faster
- Writing your written description as though you were telling a lab partner how to walk the motion to make sure you are including all important pieces of information in your description
Quiz Directions:
Look at the motion map to correctly answer the questions that follow.
Look at the motion map to correctly answer the questions that follow.