Weekly Summary:
This week, we analyzed motion that is not constant by performing and discussing the Cart on a Ramp lab. We focused on the x-t and v-t graphs, and we learned how to draw a new graph: the a-t graph. We also predicted different graphs and verified them using motion sensors. The key points mentioned were:
This week, we analyzed motion that is not constant by performing and discussing the Cart on a Ramp lab. We focused on the x-t and v-t graphs, and we learned how to draw a new graph: the a-t graph. We also predicted different graphs and verified them using motion sensors. The key points mentioned were:
- Slope of an x-t graph represents velocity
- Slope of a v-t graph represents acceleration
- Given an x-t graph, we determine how the velocity changes by analyzing how the slope changes at different points along the curve
Quiz Directions:
Match the graphs to the descriptions.
Match the graphs to the descriptions.
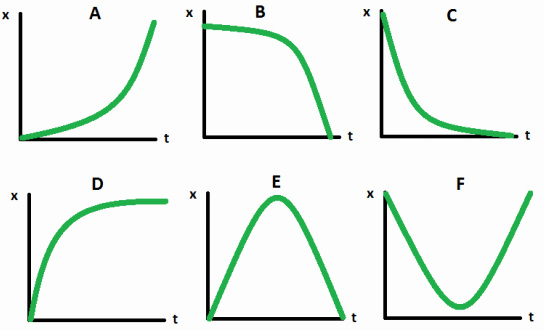
Position-Time (x-t) Graph Choices:
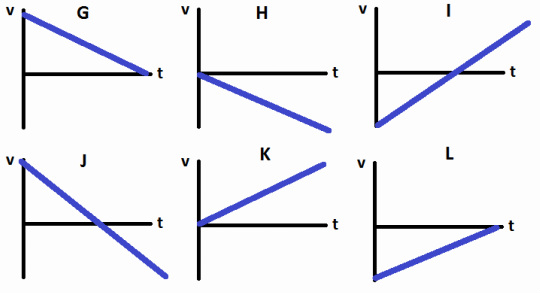
Velocity-Time (v-t) Graph Choices:
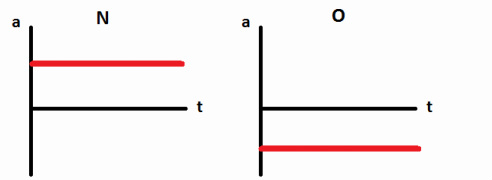
Acceleration-Time (a-t) Graph Choices: